Jump to content

Pre Earnings Pattern in Apple


As of right now, with all the focus on Apple Inc (NASDAQ:AAPL) earnings, due out on 2-1-2018 after the market closes, and its new set of iPhones, in particular the iPhone X, you can find quite convincing research pieces for a bullish thesis (an earnings beat) and equally convincing pieces on a bearish thesis (an earnings miss). 

That's great, because it means there is discord, and discord, especially for Apple ahead of earnings has meant a repeating pattern for the clever trader to take advantage of. 


One week before Apple's earnings would be January 25th, 2018. 

Apple's Disagreement 
Sometimes a bullish momentum bet works great -- and in fact, for Apple that has been a strong pattern ahead of earnings. But with a toppy market, sometimes a different approach can work as well. 

It turns out, over the long-run, for stocks with certain tendencies like Apple Inc, there is a clever way to trade market anxiety or market optimism before earnings announcements with options. 

This approach has returned 189% with 10 wins and 2 losses over the last 3-years. 

The Trade Before Earnings 
What a trader wants to do is to see the results of buying a slightly out of the money strangle one-week before earnings, and then sell that strangle just before earnings. 

Here is the setup: 
 

setup_7_1_earnings.PNG


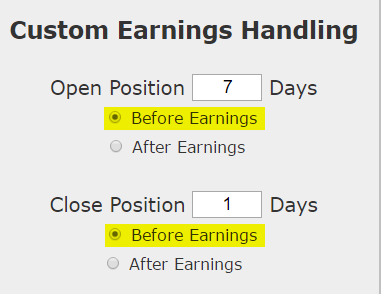
We are testing opening the position 7 calendar days before earnings and then closing the position 1 day before earnings. This is not making any earnings bet. This is not making any stock direction bet. 

Once we apply that simple rule to our back-test, we run it on a 40-delta strangle, which is a fancy of saying, buying both the 40-delta call and 40-delta put, for a non-directional bet on volatility. 

Returns 
If we did this long strangle in Apple Inc (NASDAQ:AAPL) over the last three-years, but only held it before earnings, using the options closest to 14 days from expiration, we get these results: 
 

AAPL
Long 40 Delta Strangle
 
% Wins: 83.3%
 
Wins: 10   Losses: 2
 
% Return:  189% 

Tap Here to See the Back-test


The mechanics of the TradeMachine™ are that it uses end of day prices for every back-test entry and exit (every trigger). 

We see a 189% return, testing this over the last 12 earnings dates in Apple Inc. 

We can also see that this strategy hasn't been a winner all the time, rather it has won 10 times and lost 2 times, for a 83.3% win-rate on an one-week trade. 

Setting Expectations 
While this strategy has an overall return of 189%, the trade details keep us in bounds with expectations: 
      ➡ The average percent return per trade was 16.9% over 7-days. 
      ➡ The average percent return per winning trade was 21.8% over 7-days. 
      ➡ The average percent return per losing trade was -7.6% over 7-days. 

We like the comfort of a trade that, when it loses, it isn't a disaster -- at least not historically. 

Option Trading in the Last Year 
We can also look at the last year of earnings releases and examine the results: 
 

AAPL
Long 40 Delta Strangle
 
% Wins: 100%
 
Wins: 4   Losses: 0
 
% Return:  98.2% 

Tap Here to See the Back-test


In the latest year this pre-earnings option trade has 4 wins and lost 0 times and returned 98.2%. 
      ➡ Over just the last year, the average percent return per trade was 22.3% over 7-days. 

WHAT HAPPENED 
We don't always have to look at bullish back-tests in a bull market -- sometimes a straight down the middle volatility pattern pops up. This is it -- this is how people profit from the option market -- finding trading opportunities that avoid earnings risk and work equally well during a bull or bear market. 

To see how to do this for any stock we welcome you to watch this quick demonstration video: 


Tap Here to See the Tools at Work 

Risk Disclosure 
You should read the Characteristics and Risks of Standardized Options

Past performance is not an indication of future results. 


What Is SteadyOptions?

12 Years CAGR of 120.5%

Full Trading Plan

Complete Portfolio Approach

Real-time trade sharing: entry, exit, and adjustments

Diversified Options Strategies

Exclusive Community Forum

Steady And Consistent Gains

High Quality Education

Risk Management, Portfolio Size

Performance based on real fills

Subscribe to SteadyOptions now and experience the full power of options trading!
Subscribe

Non-directional Options Strategies

10-15 trade Ideas Per Month

Targets 5-7% Monthly Net Return

Visit our Education Center

Recent Articles

Articles

  • test

    test

    By Nevo,

    • 0 comments
    • 1 view
  • The Sell Put And Buy Call Strategy | A Synthetic Long Stock

    The Sell Put And Buy Call Strategy is an example of a synthetic stock options strategy: using call and puts options to mimic the performance of a position, usually involving the purchase of a stock. We saw this when looking at the synthetic covered call strategy elsewhere.

    By Guest,

    • 0 comments
    • 60207 views
  • Long Straddle Option Strategy: The Ultimate Guide

    Straddle Options Definition
    An options straddle strategy is buying (or selling) both a put and call option with the same strike price and expiration date for the same underlying asset, and paying both the put and call premiums.

    By Guest,

    • 0 comments
    • 60107 views
  • Gamma Scalping Options Trading Strategy

    Gamma scalping is a sophisticated options trading strategy primarily employed by institutions and hedge funds for managing portfolio risk and large positions in equities and futures. As a complex technique, it is particularly suitable for experienced traders seeking to capitalize on market movements, whether up or down, as they occur in real-time.

    By Guest,

    • 0 comments
    • 25912 views
  • Short Gamma vs. Long Gamma in Options Trading

    Gamma is one of the primary Options Greeks, which measure an option's sensitivity to specific factors that could affect an option price. Despite traders hyping up several different Greeks and second-order Greeks like "Vanna" and "charm," there are only four primary Greeks that you need to be familiar with to understand options trading.


    By Guest,

    • 0 comments
    • 42076 views
  • Predicting Probabilities in Options Trading: A Deep Dive into Advanced Methods

    In options trading, the focus should not be on predicting the exact closing price of a ticker on a given date - a near-impossible task given the pseudo-random nature of markets. Instead, we aim to estimate probabilities: the likelihood of a ticker being above a specific value at a certain point in time. This perspective turns trading into a probabilistic exercise, leveraging historical data to make informed decisions.

    By Guest,

    • 1 comment
    • 12458 views
  • The Options Wheel Strategy: Wheel Trade Explained

    The “wheel” trade is variously described as a beginner’s strategy, a combination to exploit features of both calls and puts, and as “perfect” solution to the well-known risks of shorting calls, even when covered. The options wheel strategy is an income-generating options trading strategy that both beginners and experienced traders can leverage for profit.

    By Guest,

    • 0 comments
    • 66639 views
  • Why Dollar Delta Will Change Your Trading

    Delta is one of the four main option Greeks, and any serious trader needs to have a thorough understanding of this greek if they hope to have any chance of success in the trading options. If you’re a beginner, you can visit my blog to learn more about understanding option delta

    By Guest,

    • 0 comments
    • 33540 views
  • Long Call Vs. Short Put - Options Trading Strategies

    In options trading, a long call and short put both represent a bullish market outlook. But the way these positions express that view manifests very differently, both in terms of where you want the market to go and how your P&L changes over the life of the trade.

    By Guest,

    • 0 comments
    • 16045 views
  • Harnessing Monte Carlo Simulations for Options Trading: A Strategic Approach

    In the world of options trading, one of the greatest challenges is determining future price ranges with enough accuracy to structure profitable trades. One method traders can leverage to enhance these predictions is Monte Carlo simulations, a powerful statistical tool that allows for the projection of a stock or ETF's future price distribution based on historical data.

    By Guest,

    • 10 comments
    • 15267 views

  Report Article


We want to hear from you!


There are no comments to display.


Join the conversation

You can post now and register later. If you have an account, sign in now to post with your account.
Note: Your post will require moderator approval before it will be visible.

Guest
Add a comment...

×   Pasted as rich text.   Paste as plain text instead

  Only 75 emoji are allowed.

×   Your link has been automatically embedded.   Display as a link instead

×   Your previous content has been restored.   Clear editor

×   You cannot paste images directly. Upload or insert images from URL.

Loading...

Options Trading Blogs
×
×
  • Create New...